Create a fairer workplace with equitable pay and people practices that are free from bias
Gender Pay Gap
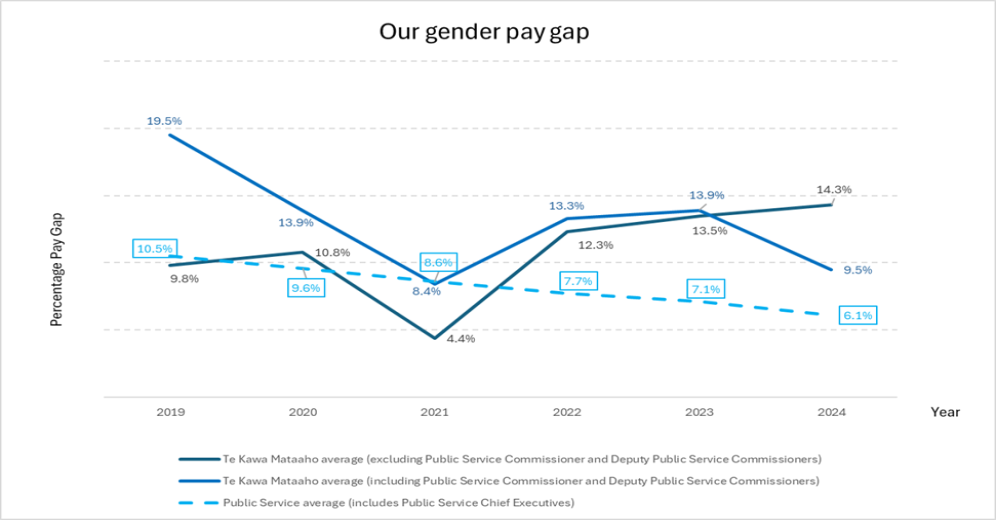
- The small Te Kawa Mataaho workforce size means that our gender pay gap can be volatile, with a small number of changes having the potential to have a significant impact.
- The Commission is unusual in that our structure includes three tier 1 statutory officers (the Public Service Commissioner and two statutory Deputy Public Service Commissioners) who are excluded from our organisational gender pay gap calculation. As all three statutory roles are currently filled by women, removing their salaries significantly reduces the overall female average salary.
- Our average (mean) gender pay gap (excluding tier one) increased slightly between 30 June 2023 and 30 June 2024 by 0.8 percent to 14.3 percent as shown in the top chart below. The key driver behind this is gender representation and the distribution of our relatively small proportion of male employees across the organisation. For example, there is a larger concentration of women in business support roles (males make up only 23.1% of business support roles), whereas males have a higher representation in more senior roles - while our people leaders below tier one were 54.5 percent female and only 42.4 percent male at 30 June 2024, the fourteen men in this grouping made up 25 percent of the total men in our organisation, while the women represent only 14.6 percent of the total women.
- The median gender pay gap for 2024 was 14.2 percent (in 2023, the median was 15.7 percent). The difference between the mean and median pay gaps is because mean pay can be influenced by a small number of employees with higher pay, whereas the median is less affected by outliers.
- As a small organisation, our gender pay gap is volatile because a variation across a small number of employees can have a significant impact. For example, the published gender pay gap for the Commission is 14.3 percent excluding the remuneration of people in tier one, however when tier one is included to match the composition of the overall public service pay gaps data (which includes Chief Executive remuneration) our gender pay gap is reduced to 9.5 percent.


*Senior leadership includes deputy commissioners and assistant commissioners due to the small numbers in each group but excludes the three tier 1 statutory officers (Public Service Commissioner and two Deputy Public Service Commissioners).
Manager and chief advisor roles are combined in this chart due to the small number of chief advisors. Chief advisors provide ‘thought leadership’ but are not people leaders.
Data includes employees identifying as female or male but does not report unknown or other genders.
Gender share data is at 30 June 2024.
Create a fairer workplace with equitable pay and people practices that are free from bias
Ethnic pay gaps
As a small agency, we have fewer people of most ethnicities than would normally be reported. StatsNZ and workforce guidance recommends only reporting pay gaps only where there are more than 20 people in each group, to help protect privacy and produce robust measures (because pay gaps can be volatile over time when measured for small numbers of employees).
The chart below depicts the mean and median pay gaps for Māori, Pacific and Asian employees. The difference between mean and median pay gaps is because mean pay can be influenced by a small number of employees with higher pay, whereas the median is less affected by outliers.

The 0 percent line represents a zero pay gap.
Ethnic pay gaps exclude tier one roles due to the disproportionate impact of a small number of employees.
We review pay for individuals to ensure there is equity between those in the same or similar roles, and we have made continued progress in closing ethnic pay gaps. Closing ethnic pay gaps in a sustainable way requires an increase in representation across role levels that is maintained over time. Our analysis shows the following:
- We do not have a pay gap for Māori, with Māori employees currently earning more on average than non-Māori employees due to the higher representation of Māori employees at leadership levels.
- We have made some progress in reducing our average (mean) Pacific pay gap from 10.5 percent at 30 June 2023 to 4.3 percent at 30 June 2024. We do not have a pay gap for our Pacific employees using median pay.
- The average (mean) pay gap for our Asian employees was 17.6 percent as at 30 June 2024, a reduction from 25.5 percent in 2023 which had been the first time we had sufficient numbers of Asian employees to be able to report the pay gap. While we are making progress, the extant gap reflects that we don’t currently have many people in leadership roles who identify as Asian. The median pay gap is currently 10.3 percent for this ethnic group.
The limitations of having a small agency data set means that our results may not meet the standards recommended by Stats NZ to ensure robust results. We report pay gaps for Māori, Pacific and Asian employees with the qualifier that we have fewer than the recommended minimum group size of 20 people in each of these groups. We have too few employees of other ethnicities, such as Middle Eastern, Latin American and African (MELAA), to report on pay gaps