-
Section 01
Ministers’ Foreword
-
Section 02
Executive Summary
-
Section 03
An overview of progress to date — summary
-
Section 04
An overview of progress to date
-
Section 05
Factors in the success of the Action Plan so far
-
Section 06
Remaining challenges
-
Section 07
Appendices
-
Section 08
Further information
Drivers of the gender pay gap
The gender pay gap arises from a complex interplay of societal norms around gender, family and work that is then reflected in workplaces.
Drivers of the gender pay gap include the uneven distribution of unpaid caring and domestic work, a concentration of women in lower-paid occupations and in part-time work, a lack of women in leadership, limited options for flexible work in higher-paid roles, and the undervaluation of work which is largely performed by women.
Gender bias and discrimination also play a significant role. Recent New Zealand research on the nation-wide gender pay gap shows that the gap is mostly driven by hard to see and measure factors, like bias and differences in men’s and women’s choices and behaviours.
Empirical evidence of GPG in NZ, March 2017 — Ministry for Women
Many women experience multiple workplace barriers associated with the combined effects of gender, ethnicity and disability. Māori and Pacific women are more concentrated in lower paid occupations than other women so reducing occupational segregation and appropriately valuing female dominated work will be particularly important for these women.
Shifting wider societal attitudes around gender, work and family will take time. However, employers have an important role to play. They can and should take action in the short-term to address gender pay gaps in their workplaces to help progress gender equity.
Women in leadership in the Public Service
“I’m very proud that the Public Service is leading the way in Aotearoa l New Zealand and internationally on women’s representation in leadership.”
Peter Hughes, State Services Commissioner
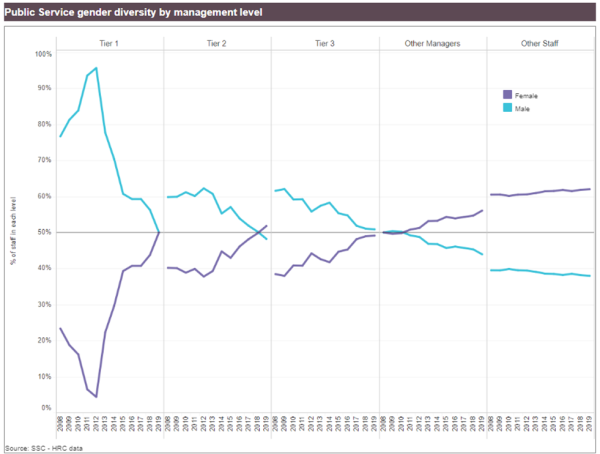
Increasing women’s representation in leadership helps to reduce gender pay gaps, and the proportion of women in Public Service leadership has increased strongly in the last decade.
Women now make up 50%of the top three tiers of the Public Service, and half of its chief executives. As well, in 19 agencies women held 50% or more of leadership positions, compared with 15 agencies in 2018. In contrast, in the private sector levels of women in leadership are low, 23.5% for NZX listed companies.
The State Services Commissioner also recognises that we need a pipeline of more diverse women leaders, and to see Māori, Pacific and Asian women better represented at all levels.
Agencies that have not yet reached gender balance in their own leadership teams are developing a plan and target date to achieve this.
Description of Figure 4
Figure 4 is made up 5 line graphs side by side. The horizontal axis in each section shows the years 2008 to 2019. The vertical axis shows percentages from 0% to 1005 in 10% intervals. There are two lines in each graph showing the percentage of men in blue and women in purple at each management level of the Public Service.
The first line graph shows that the percentage of women in tier 1 management has increased from approximately 25% in 2008 to 50% in 2019. It also shows that the percentage of men in tier 1 management has decreased from approximately 75% in 2008 to 50% in 2019.
The second line graph shows that the percentage of women in tier 2 management has increased from approximately 40% in 2008 to approximately 52% in 2019. It also shows that the percentage of men in tier 2 management has decreased from approximately 60% in 2008 to approximately 48% in 2019.
The third line graph shows that the percentage of women in tier 3 management has increased from approximately 40% in 2008 to approximately 50% in 2019. It also shows that the percentage of men in tier 3 management has decreased from approximately 60% in 2008 to approximately 40% in 2019.
The fourth line graph shows that the percentage of women who are other managers has increased from approximately 50% in 2008 to approximately 55% in 2019. It also shows that the percentage of men who are other managers has decreased from approximately 50% in 2008 to approximately 45% in 2019.
The fifth line graph shows that the percentage of women who are other staff has increased from approximately 60% in 2008 to approximately 62% in 2019. It also shows that the percentage of men who are other staff has decreased from approximately 40% in 2008 to approximately 38% in 2019.

Figure 4: Public Service gender diversity by management level 2008–2019
Increasing the Ministry’s flexible work capability — Ministry for Primary Industries
“Without the ability to work flexibly I wouldn't have been able to progress my career in something I absolutely love … and to raise my children the way I want to.”
Peggy Koutsos, Principal Advisor, Ministry for Primary Industries
Flexible working has been a key component of the Ministry for Primary Industries’ (MPI) diversity and inclusion strategy since 2017. Many people at MPI were already working flexibly, both formally and informally, but their experiences, and attitudes towards flexible work, weren’t consistent across the business.
MPI developed a plan to build the agency’s flexible working capability, engaging with unions throughout the development of the strategy and its implementation. The PSA was a great advocate and support for the work MPI was promoting.
The initiatives and tools used to build flexible working capability include:
- Engagement through a series of 22 workshops and focus groups throughout the country and an organisation-wide survey to understand more about how flexible work operates within the Ministry, how supportive the agency is, what barriers exist, and attitudes to and experiences of flexible working.
- Peer-to-peer learning sessions to provide staff and managers with a forum to share experiences, best practice and learn from others.
- Normalising flexible working through case study videos of diverse employees and leaders who make flexible working ‘work for them’.
- An online information hub on the Ministry’s intranet to increase awareness of flexible working and why it’s important. It includes information on the different flexible working options available, rights and obligations, and points people to more information and resources including manager and employee toolkits.
- An eLearning page to provide practical behaviour change ideas for MPI managers and teams, equipping them with the knowledge and approaches to work more flexibly. Resources include flexible working team charter templates, technology suggestions, team culture resources, references for mental health, and messages for managers on ways of managing remote teams.
Gender pay gap transparency and measurement in the Public Service
The Public Service has highly transparent workforce data, updated and published annually. This transparency aligns with the Gender Pay Principle of Transparency and Accessibility.
Gender pay gaps for the Public Service and individual agencies were first published in 2016, with information available going back to 2000. Other Public Service workforce information, such as the proportion of women in leadership and average pay by ethnic group, is also publicly available and updated through a comprehensive annual survey. These data series are useful monitoring and analytical tools for the Taskforce and for agencies. The State Services Commission also publishes an annual commentary on changes and trends in the Public Service Workforce, including an analysis of its gender pay gap.
The State Services Commission reports the Public Service gender pay gap using mean pay. In contrast, StatsNZ uses median hourly pay when reporting the gender pay gap for the entire workforce.
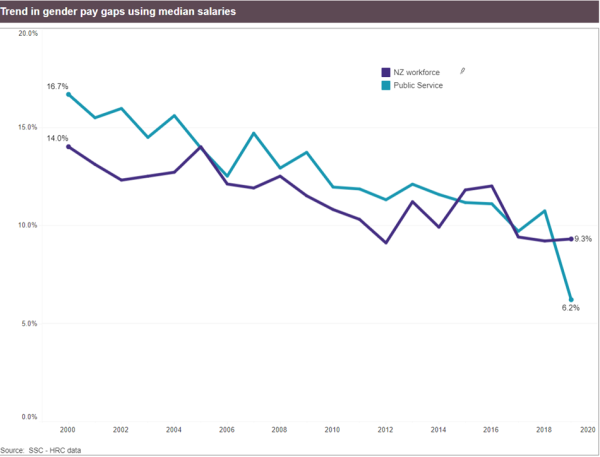
In 2019, the Public Service gender pay gap using median pay was 6.2%, a large fall from 10.7% in 2018. For comparison, NZ’s gender pay using median pay was 9.3% in 2019.
Description of Figure 5
Figure 5 is a line graph showing the trend in NZ workforce and Public Service gender pay gaps using median salaries from 2000-2019. The horizontal axis shows years from 2000 to 2019. The vertical axis shows percentages from zero percent to 20% in 5% intervals.
There are two lines in the line graph. The purple line shows that the national gender pay gap has decreased from 14% in the year 2000 to 9.3% in 2019. The blue line shows that the Public Service gender pay gap has decreased from 16.7% in 2000 to 6.2% in 2019.

Figure 5: Trend in NZ workforce and Public Service gender pay gaps using median salaries 2000-2019
Ensuring gender is not a factor in its starting salaries — The Department of Corrections
“What we found when we looked at the data was that women were starting on lower salaries than men and they weren't catching up … and this wasn't OK for us.”
Richard Waggott, Deputy Chief Executive, Corrections
More than 80% of the Department of Corrections workforce is employed on collective agreements with transparent pay scales and set criteria for progression. Starting salaries for most of these roles are the same and staff progress according to a structure competency system and/or qualification. This has been the main contributor to a zero gender pay gap within this segment of the workforce. However, the Department identified a gender pay gap in the remaining 20% of the workforce which is employed on individual employment agreements.
Corrections has developed resources and systems to ensure gender is not a factor in setting salaries for appointments on salary bands, including:
- a guide on starting salaries for hiring managers with criteria for each percentile of the salary ranges
- an online tool for hiring managers and panels showing the average and range of current salaries for the role, accounting for the length of service of existing employees
- appointment panels recommending a starting salary for new appointments
- the human resources department testing proposed starting salaries for adverse effects on the gender pay gap
- monitoring starting salaries at regular intervals.
The guidance ensuring bias is not a factor in setting starting salaries drew on Corrections’ experience and approach.
Guidance: Ensuring bias does not influence starting salaries
The Treasury is actively working to increase the representation of women at all levels of its organisation. It is using our recruitment guidance to review its policies and practices, to identify and reduce bias at the start of the employment life cycle.
For example:
- All job ads are checked for gender-neutral language
- Recruitment documentation prompts managers to consider the impact of selection decisions on gender balance in their teams and across the Treasury
- Hiring managers use a tool to understand how a proposed new starter salary will impact on various organisational gender pay gaps.
The Treasury is also planning to:
- Have panel members for all interviews complete unconscious bias training
- Focus on mixed interview panels and mixed shortlists (internally)
- Make shortlisting decisions in groups, rather than by hiring managers
- Analyse and report data at each step of the recruitment process to identify where women drop out
- Use te Reo Māori in advertised job titles and job descriptions
- Introduce a talent acquisition focus on Māori capability
- Increase transparency of salary and remuneration ranges during recruitment
- Retrospectively analyse the progression of graduates with a gender focus.
Managers will receive training, guidance, and updated tools on what is expected at each step of the recruitment process in order to reduce gender bias.
Treasury drew on the Recruitment Guidance: Implementing the Gender Pay Principles and removing gender bias in recruitment processes
“We've eliminated bias from our recruitment and promotion systems so that everyone has an equal opportunity to succeed …. and I just feel incredibly grateful to work in an organisation where we’ve been able to make such a massive difference for the people who work here.”
Jacinda Funnell, Deputy Chief Executive, NZ Customs Service