-
Section 01
Raraunga Ohumahi 2022 — Kaiārahi Matua Workforce data 2022 — Senior leadership
-
Section 02
Raraunga Ohumahi 2022 — Taiutu Workforce data 2022 — Remuneration/pay
-
Section 03
Raraunga Ohumahi 2022 — Māori Karauna Workforce data 2022 - Māori Crown
-
Section 04
Raraunga Ohumahi 2022 — Ta te rāngai tūmatanui hanga Workforce data 2022 — Public sector composition
-
Section 05
Raraunga Ohumahi — Te Kanorau me te Whakaurunga Workforce data 2022 — Diversity and inclusion
-
5.1
Raraunga Ohumahi — Te iwitanga i roto i te Ratonga Tūmatanui Workforce Data 2022 — Ethnicity in the Public Service
-
5.2
Raraunga Ohumahi — Te Ira Tangata i roto i Te Ratonga Tūmatanui Workforce Data 2022 — Gender representation in the Public Service
-
5.3
Raraunga Ohumahi 2022 — Āniwaniwa Workforce Data 2022 — Rainbow
-
5.4
Raraunga Ohumahi — Hunga whaikaha Workforce Data 2022 — Disability
-
5.5
Raraunga Ohumahi 2022 — Kāhua taipakeke Workforce Data 2022 — Age profile
-
5.6
Raraunga Ohumahi 2022 — Hāhi Workforce Data 2022 — Religion
-
5.7
Raraunga Ohumahi 2022 — Whakaurunga Workforce Data 2022 — Inclusion
-
5.1
-
Section 06
Raraunga Ohumahi 2022 — Te mahi i roto i te Rāngai Tūmatanui Workforce data 2022 - Working in the Public Service
-
6.1
Raraunga Ohumahi 2022 — Paearu mahi Workforce Data 2022 — Conditions of employment
-
6.2
Raraunga Ohumahi 2022 — Te hauora i roto i te mahi Workforce Data 2022 — Wellbeing at work
-
6.3
Raraunga Ohumahi 2022 — Te whakataurite oranga me te mahi Workforce Data 2022 — Balancing life and work
-
6.4
Raraunga Ohumahi 2022 — Te nekeneke Workforce Data 2022 — Mobility
-
6.5
Raraunga Ohumahi 2022 — Wairua Whakarato Workforce Data 2022 — Spirit of Service
-
6.6
Raraunga Ohumahi 2022 — Te āheinga Workforce Data 2022 — Capability
-
6.1
-
Section 07
Data drilldowns and technical guidance 2022
The data we collect provides information about employees who earned over $100,000, personal expenditure in Crown agencies, Public Service salary cost and performance pay.
Employees who earned over $100,000
The numbers of staff (excluding chief executives) who received $100,000 or more in total remuneration (including base salary plus any superannuation, performance and redundancy payments) are shown in 2 tables below, one for tertiary education institutions and the other for Public Service departments and selected agencies.1 These figures are collected separately from other Workforce Data reported by Te Kawa Mataaho Public Service Commission, where salary is instead defined as full-time equivalent base salary as at 30 June. As wage inflation increases salaries each year, more employees are moving into the $100,000+ income bracket.2
In 2022, 19,634 staff in the Public Service and selected agencies earned over $100,000, an increase of 1,333 or 7.3%. Most of the increase (around 80%) was in those who earned between $100,000 and $130,000. The number of employees in the tertiary education institutions group increased in the academic year to 31 December by 991 or 12.4% (up from last year’s increase of 0.9% which was likely to be a small underestimate, due to data collection changes resulting from the Reform of Vocational Education (RoVE) and the introduction of Te Pūkenga).

1 Data covers 36 Public Service departments and departmental agencies, as well as 6 selected agencies whose chief executives are under the Remuneration Authority jurisdiction, including the Audit Office, Office of the Clerk of the House of Representatives, Office of the Ombudsmen, Parliamentary Service, Parliamentary Counsel Office, and Parliamentary Commissioner for the Environment. Data also covers 12 tertiary education institutions in 2022 (26 in 2019).
2 In 1998, Cabinet agreed that the disclosure of public sector remuneration would follow the Companies Act 1993 requirement, where total remuneration would be disclosed when it was above $100,000 (CAB (98) M8/3B(1)). This value of 100,000 has not been adjusted to account for inflation since 1993. If you did this, using the CPI, we estimate the amount would be around $190,000 in 2022.
Personnel expenditure in Crown agencies
The Treasury publishes annual ‘Financial Statements of the Government of New Zealand’ each year. These statements include personnel expenditure, which covers total remuneration paid to employees. It includes payments such as salaries, employer contributions to superannuation, long service leave entitlements, performance, and severance. Personnel expenses for core government agencies increased by 6.3% to $9,945 million in the 2022 June year, while the total Crown personnel expenditure increased by 9.5% to $32,648 million as shown in the table below.
|
Personnel expenditure in Core Crown and Total Crown, June year 2017-2022 |
||||||
|
|
2017 |
2018 |
2019 |
2020 |
2021 |
2022 |
|
Core Crown* personnel expenditure ($m) |
$6,890 |
$7,249 |
$7,794 |
$8,480 |
$9,358 |
$9,945 |
|
Annual change (%) |
3.4% |
5.2% |
7.5% |
8.8% |
10.4% |
6.3% |
|
Total Crown** personnel expenditure ($m) |
$22,599 |
$23,690 |
$25,933 |
$27,775 |
$29,817 |
$32,648 |
|
Annual change (%) |
2.9% |
4.8% |
9.5% |
7.1% |
7.4% |
9.5% |
*Core Crown — includes ministers, government departments, departmental agencies, interdepartmental executive boards, interdepartmental ventures, the New Zealand Defence Force, the New Zealand Police, the Parliamentary Counsel Office, the Office of the Clerk of the House of Representatives, the Parliamentary Service, the NZS Fund and the Reserve Bank of NZ.
**Total Crown — includes the core Crown plus Crown entities and state-owned enterprises.
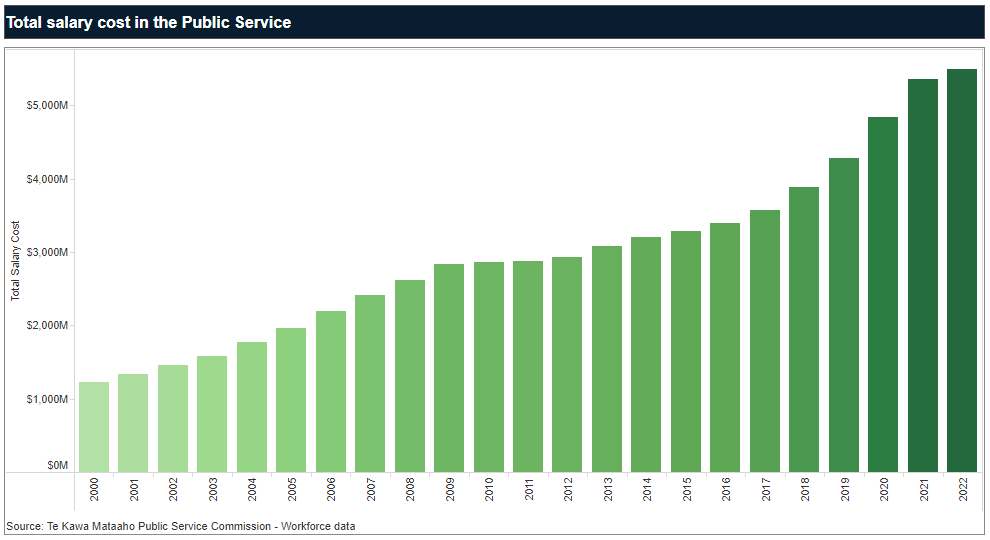
Public Service salary cost
Expenditure on base salaries is the single largest component of personnel expenditure (others include superannuation, overtime, redundancy costs, and so on). The total salary cost shown in the first tab on the chart below is calculated by multiplying the number of FTE employees in the Public Service by the average annual FTE base salary. These are approximate annual salary costs and don’t represent total personnel expenditure.
The total base salary cost for the Public Service in 2022 increased by 2.4% ($129 million) to $5,495 million. This follows larger increases in the previous 2 years of 12.9% in 2020 and 10.8% in 2021. The latest increase was produced by a rise in average salary (3.7%) coupled with a small decrease in FTE staff numbers (1.2%).
Total salary cost by occupation group is the product of average base salary and the number of FTE staff in that group. The Manager group had the largest cost at $1,132.1 million in the year to 30 June 2022, as shown on the second tab in the chart above. The second largest cost was for the Social, Health and Education Workers at $868.3 million, followed by Information Professionals at $830.4 million and the Inspectors and Regulatory Officers group at $791.1 million. These four groups accounted for just under two-thirds (66%) of public service employee salary costs. By occupation group, the largest increase in salary cost was in Managers: up $92.5 million or 8.9%. The largest decrease was in Contact Centre Workers: down $23.9 million or 8.4%. However, neither of these changes accurately reflect real world changes over the past year. They have been driven by changes in how agencies, particularly Inland Revenue, code their roles to occupation groups.
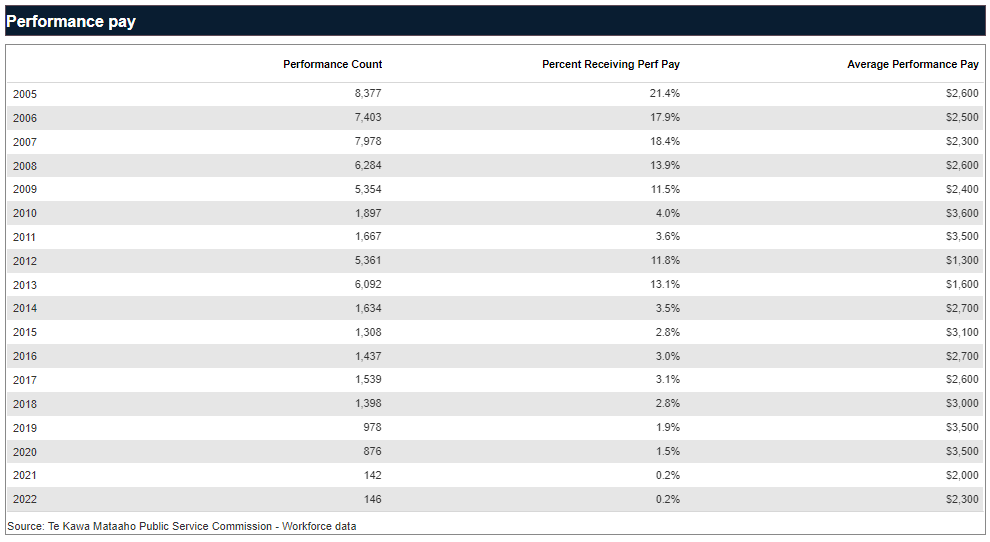
Performance pay: Superannuation: Redundancy
Performance pay is defined as a one-off payment to staff in recognition of outstanding performance, excluding one-off payments made in lieu of other remuneration adjustments. In the year to 30 June 2022, 0.2% or 146 public service employees received a performance pay with the average value of $2,300 (see the first tab on the chart below). These figures are similar to 2021, maintaining the large drop from previous years, particularly in terms of the number of people receiving performance payments.
One of the Government Expectations for employment relations in the public sector is that employers work towards removing at-risk pay and performance bonuses from pay policies and employment agreements. This directive is now being shown in our reporting.
The chart on the second tab above shows recent trends of public service participation in superannuation schemes. As at 30 June 2022, 92.3% of public service employees were members of at least one employer-subsidised superannuation scheme (up from 91.4% last year). The majority of staff (82.4%) belonged to KiwiSaver, with 10.8% in the State Sector Retirement Savings Scheme (SSRSS). Membership of KiwiSaver has increased steadily as new employees join the Public Service. SSRSS and the Government Superannuation Fund (GSF) schemes were closed to new members in 2008 and 1992 respectively, and the number of employees in those schemes are decreasing gradually as members leave the Public Service.
The chart on the third tab shows that in the year to 30 June 2022, 319 employees in the Public Service were made redundant (up slightly from 311 in 2021). The average redundancy payment was $96,800 (up from $68,200 in 2021). The main driver behind the 2022 figures was Inland Revenue, with nearly two thirds (63%) of all redundancies, as it completes its large transformation programme.
The total cost of redundancy increased to $30.9 million (from $21.2 million in 2021), the highest figure since 2013. Twenty-two departments reported redundancies.