-
Section 01
Workforce data 2023 - Senior leadership
-
Section 02
Workforce data 2023 - Remuneration/pay
-
Section 03
Workforce data 2023 - Public sector composition
-
Section 04
Workforce data 2023 - Diversity and inclusion
-
4.1
Raraunga Ohumahi - Te iwitanga i roto i te Ratonga Tūmatanui Workforce Data 2023 - Ethnicity in the Public Service
-
4.2
Raraunga Ohumahi - Te Ira Tangata i roto i Te Ratonga Tūmatanui Workforce Data 2023 - Gender representation in the Public Service
-
4.3
Raraunga Ohumahi - Āniwaniwa Workforce Data 2023 - Rainbow
-
4.4
Raraunga Ohumahi - Hunga whaikaha Workforce Data 2023 - Disability
-
4.5
Raraunga Ohumahi - Kāhua taipakeke Workforce Data 2023 - Age profile
-
4.6
Raraunga Ohumahi - Hāhi Workforce Data 2023 - Religion
-
4.7
Raraunga Ohumahi - Whakaurunga Workforce Data 2023 - Inclusion
-
4.1
-
Section 05
Workforce data 2023 - Working in the Public Service
-
5.1
Raraunga Ohumahi - Te hauora i roto i te mahi Workforce Data 2023 - Wellbeing at work
-
5.2
Raraunga Ohumahi - Paearu mahi Workforce Data 2023 - Conditions of employment
-
5.3
Raraunga Ohumahi - Te whakataurite oranga me te mahi Workforce Data 2023 - Balancing life and work
-
5.4
Raraunga Ohumahi - Te nekeneke Workforce Data 2023 - Mobility
-
5.5
Raraunga Ohumahi - Te āheinga Workforce Data 2023 - Capability
-
5.1
-
Section 06
Guidance: Data drilldown and technical guidance 2023
Workforce Data tables and visualisations showing demographic summaries, workforce metrics and detailed workforce views and experience, as well as helpful definitions.
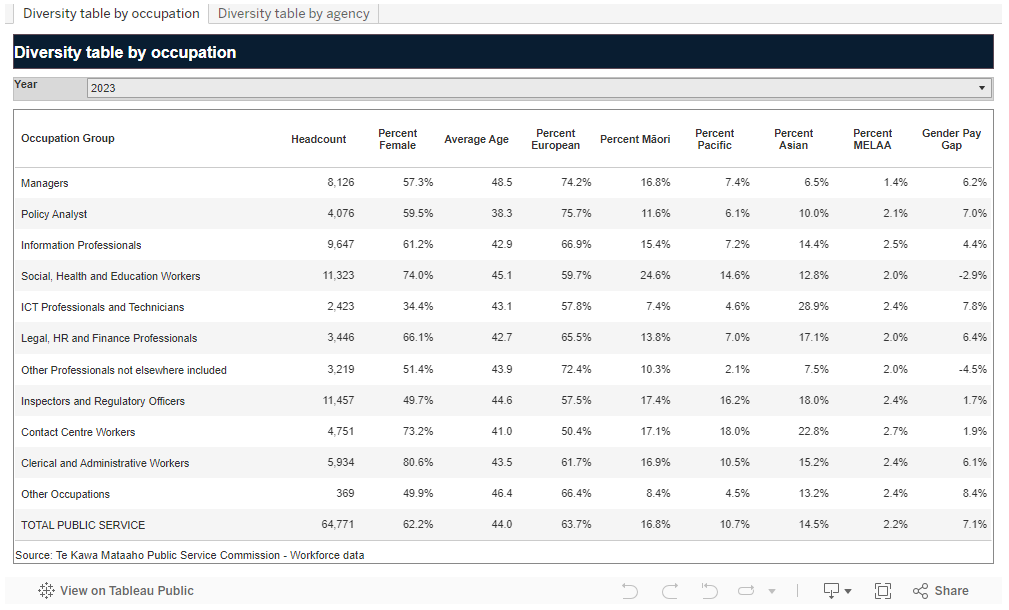
Demographic summary — Workforce Data from HR records
The following interactive tables show key demographic measures by department and occupational group.
Detailed workforce metrics over time — Workforce Data from HR records
The following visualisation displays data by department and workforce metrics over time.
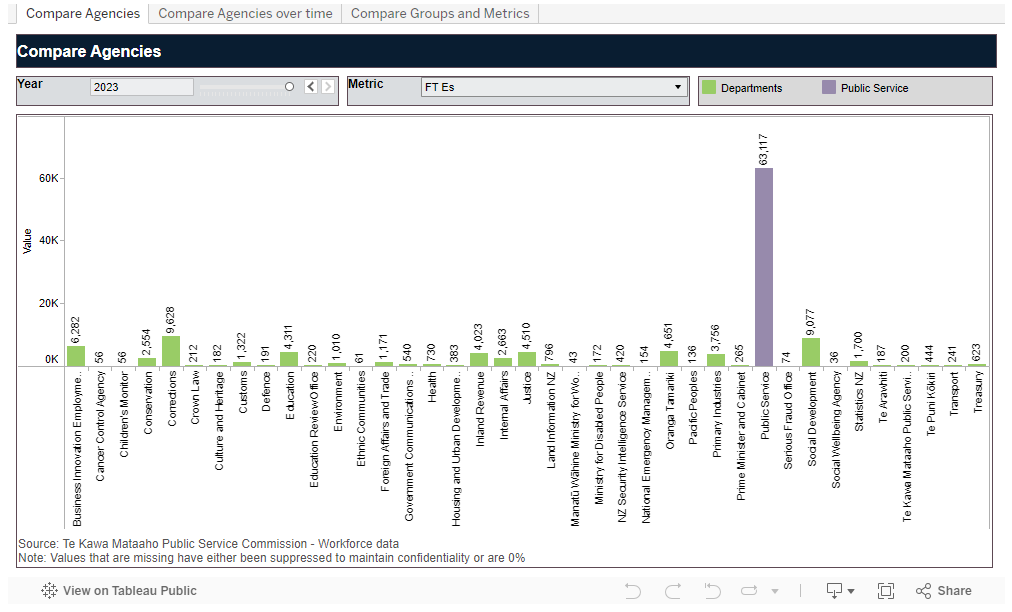
Note: Values that are missing have either been suppressed to maintain confidentiality or are 0%.
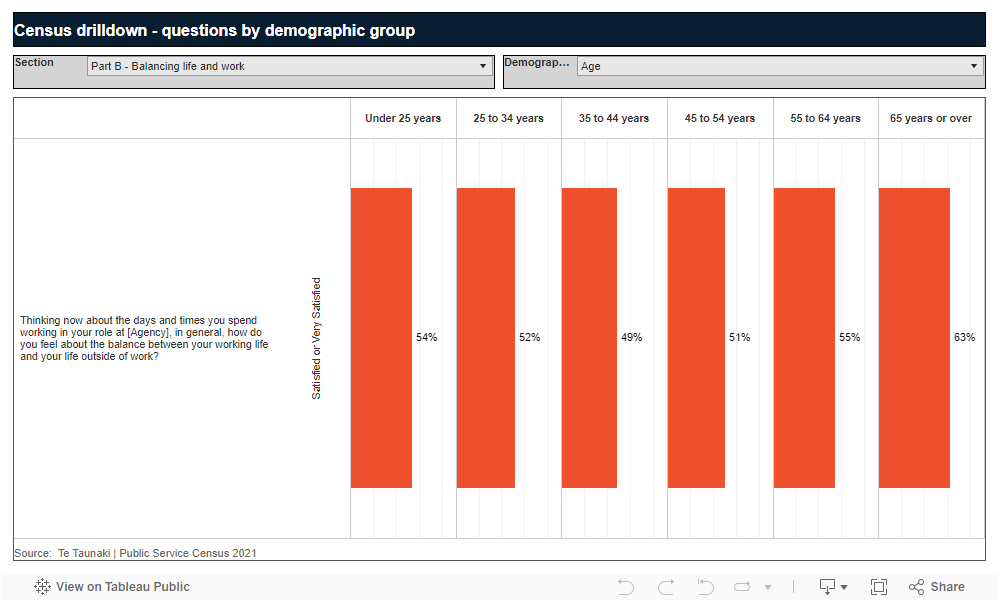
Detailed workforce views and experience — Te Taunaki Public Service Census
The following visualisation provides the views and experiences of Public Service staff by subject and demographic groups (captured via questions and agreement scales asked in Te Taunaki Public Service Census and Workforce Data 2021).
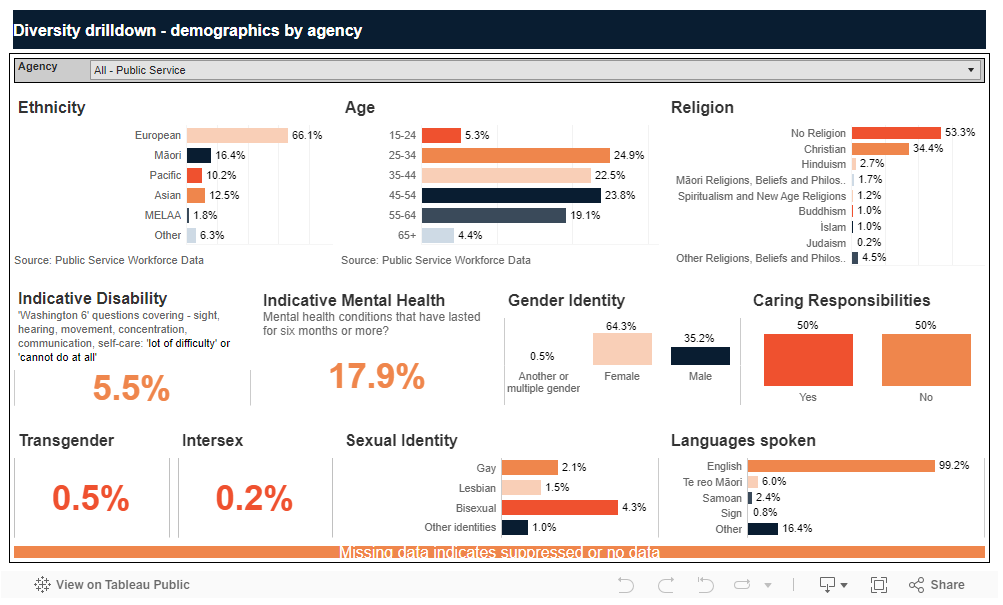
Diversity demographics summary — Te Taunaki Public Service Census
The following visualisation shows the diversity of Public Service staff by department (as captured in questions asked in Te Taunaki Public Service Census 2021).