-
Section 01
Workforce data 2023 - Senior leadership
-
Section 02
Workforce data 2023 - Remuneration/pay
-
Section 03
Workforce data 2023 - Public sector composition
-
Section 04
Workforce data 2023 - Diversity and inclusion
-
4.1
Raraunga Ohumahi - Te iwitanga i roto i te Ratonga Tūmatanui Workforce Data 2023 - Ethnicity in the Public Service
-
4.2
Raraunga Ohumahi - Te Ira Tangata i roto i Te Ratonga Tūmatanui Workforce Data 2023 - Gender representation in the Public Service
-
4.3
Raraunga Ohumahi - Āniwaniwa Workforce Data 2023 - Rainbow
-
4.4
Raraunga Ohumahi - Hunga whaikaha Workforce Data 2023 - Disability
-
4.5
Raraunga Ohumahi - Kāhua taipakeke Workforce Data 2023 - Age profile
-
4.6
Raraunga Ohumahi - Hāhi Workforce Data 2023 - Religion
-
4.7
Raraunga Ohumahi - Whakaurunga Workforce Data 2023 - Inclusion
-
4.1
-
Section 05
Workforce data 2023 - Working in the Public Service
-
5.1
Raraunga Ohumahi - Te hauora i roto i te mahi Workforce Data 2023 - Wellbeing at work
-
5.2
Raraunga Ohumahi - Paearu mahi Workforce Data 2023 - Conditions of employment
-
5.3
Raraunga Ohumahi - Te whakataurite oranga me te mahi Workforce Data 2023 - Balancing life and work
-
5.4
Raraunga Ohumahi - Te nekeneke Workforce Data 2023 - Mobility
-
5.5
Raraunga Ohumahi - Te āheinga Workforce Data 2023 - Capability
-
5.1
-
Section 06
Guidance: Data drilldown and technical guidance 2023
The data we collect gives us information about the occupational profile of the workforce, staff numbers, occupational trends and customer-facing roles.
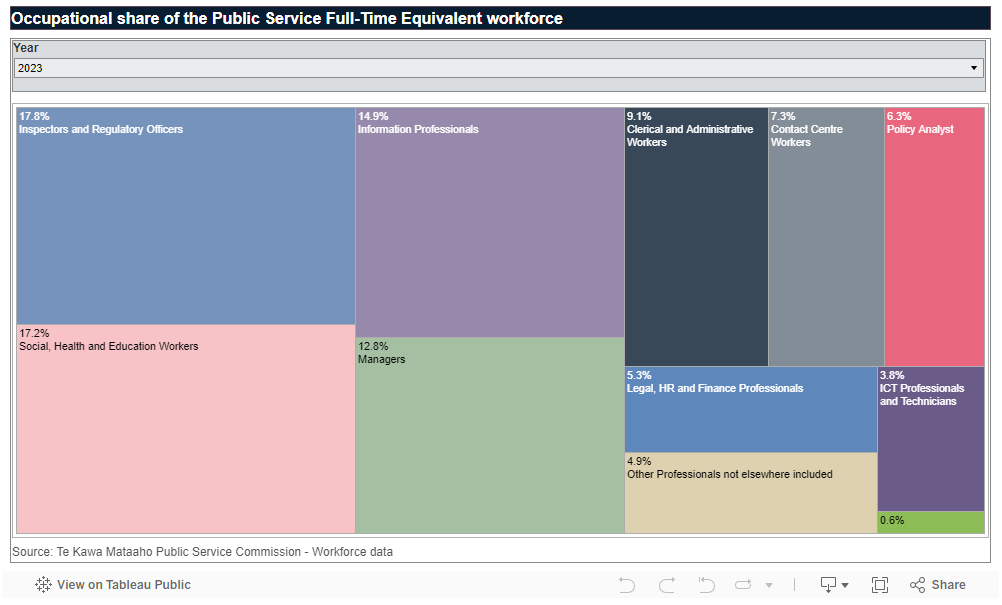
Occupational profile of workforce
Public Service employees were engaged in a wide range of jobs spread across 239 different occupations in 2023. These can be divided into 10 broad occupational groups as shown in the following chart.
In 2023, the two largest groups are inspectors and regulatory officers and social, health and education workers, accounting for 17.8% and 17.2% respectively of the Public Service workforce. However, these shares have been declining over time, as these occupation groups have grown at a slower rate than the rest of the Public Service workforce. This is especially true for inspectors and regulatory officers, whose share has fallen from a 2017 peak of 22.2% (when the operation of Mount Eden Prison returned to the Department of Corrections from a private provider) to its lowest level since records began. Contributing to this decline from 2017 to 2023 has been the Business Transformation at Inland Revenue, and a reduction in corrections officer numbers in the last three years.
The third largest group, information professionals, has 14.9% of all the Public Service workforce. This is the highest level on record – the share of this group has increased steadily since records began in 2007. Part of this growth involves the design and support of digital services. Information professionals encompass various roles, such as data analysts, business and intelligence analysts, service designers, non-policy advisors, librarians, archivists, project managers, statisticians, and governance roles.
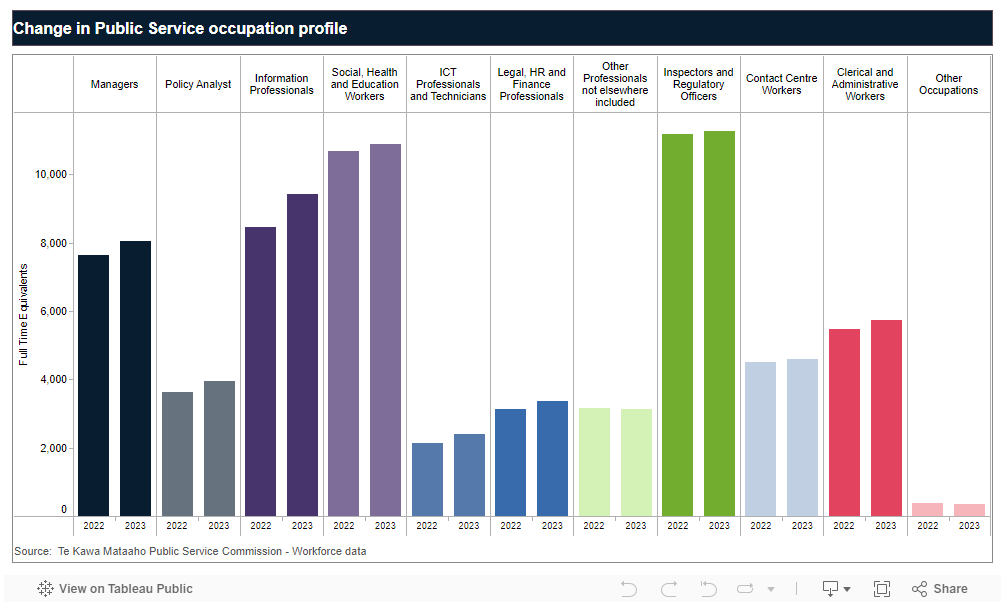
Staff numbers by occupation
Between 2022 and 2023, the Public Service workforce (FTEs) increased by 2,736 or 4.5%.
The largest changes over the past year were increases in the number of information professionals (up 956 FTEs, or 11.3%), managers (up 414 FTEs, or 5.4%) and policy analysts (up 317 FTEs, or 8.7%). Proportionally, the largest occupation change was for ICT professionals and technicians (up 12.1% or 258 FTE). These increases were driven by the need to meet Government priorities, as well as the filling of vacancies through the year. Proportional growth of managers at 5.4% is the slowest since 2017, although some of this historic growth reflects changes in how agencies code their roles to occupation groups, rather than recruitment of new managers. Managers may be working in a wide variety of roles, such as, service delivery managers, contact centre managers or court security managers.
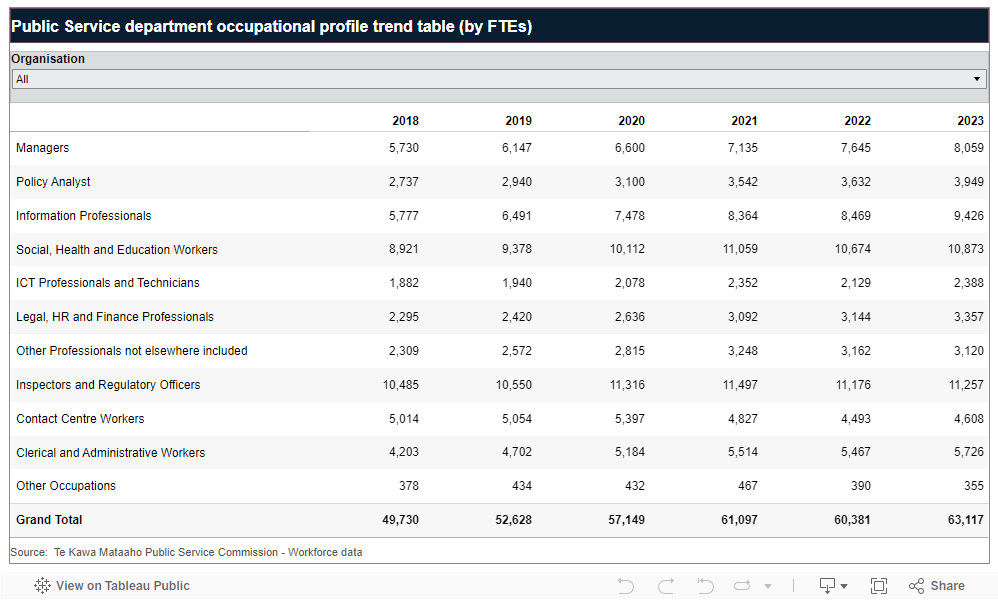
Public Service occupational trends
The following table shows how occupation groups by Public Service department have changed over the last 5 years.
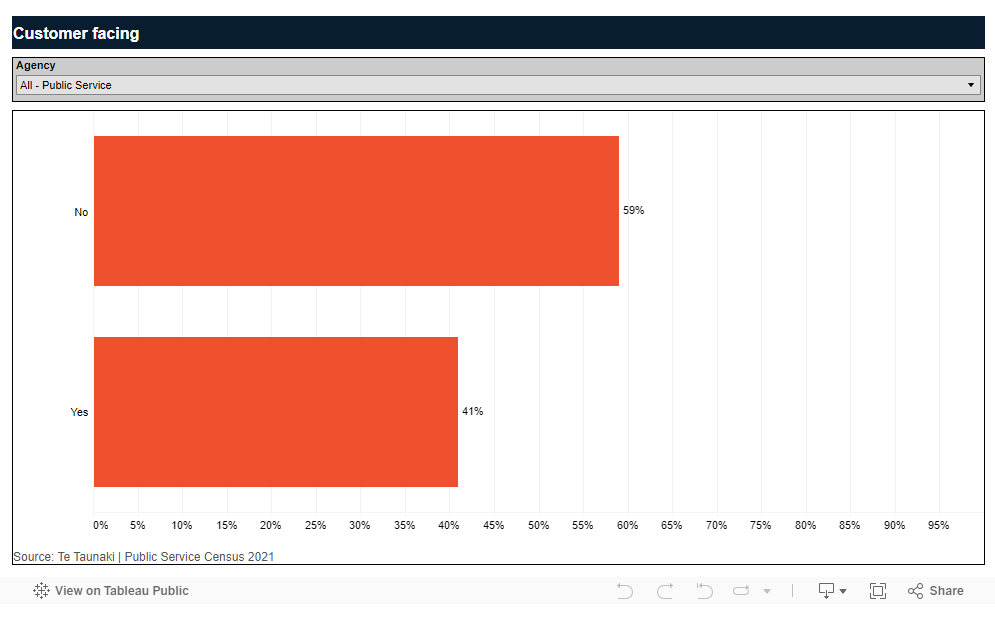
Customer-facing roles
Just over 40% of public servants who responded to the Te Taunaki Public Service Census 2021 survey have customer-facing roles, working directly with the public, external customers and clients, or people in their care. Of those who responded to the survey, two-thirds of customer-facing workers were female.
Communications staff
The Workforce Data collection, which is based off administrative payroll data, can’t measure smaller workforces such as communications staff with great precision. Communications employees are instead included in the ‘other professionals not included elsewhere’ occupation group in Workforce Data reporting. To get accurate communications workforce figures, we run a separate data collection from agencies. This uses a communications workforce definition from 2022 guidance developed by Te Kawa Mataaho Public Service Commission.
Guidance: Communications function definition - Te Kawa Mataaho Public Service Commission
Using this definition, there were 488.4 full-time equivalent (FTE) Communications staff across Public Service departments and departmental agencies at 31 March 2024. This is a decrease of 4.9% (or 25.1 FTEs) from 513.5 FTEs in September 2023.