-
Section 01
Workforce data 2023 - Senior leadership
-
Section 02
Workforce data 2023 - Remuneration/pay
-
Section 03
Workforce data 2023 - Public sector composition
-
Section 04
Workforce data 2023 - Diversity and inclusion
-
4.1
Raraunga Ohumahi - Te iwitanga i roto i te Ratonga Tūmatanui Workforce Data 2023 - Ethnicity in the Public Service
-
4.2
Raraunga Ohumahi - Te Ira Tangata i roto i Te Ratonga Tūmatanui Workforce Data 2023 - Gender representation in the Public Service
-
4.3
Raraunga Ohumahi - Āniwaniwa Workforce Data 2023 - Rainbow
-
4.4
Raraunga Ohumahi - Hunga whaikaha Workforce Data 2023 - Disability
-
4.5
Raraunga Ohumahi - Kāhua taipakeke Workforce Data 2023 - Age profile
-
4.6
Raraunga Ohumahi - Hāhi Workforce Data 2023 - Religion
-
4.7
Raraunga Ohumahi - Whakaurunga Workforce Data 2023 - Inclusion
-
4.1
-
Section 05
Workforce data 2023 - Working in the Public Service
-
5.1
Raraunga Ohumahi - Te hauora i roto i te mahi Workforce Data 2023 - Wellbeing at work
-
5.2
Raraunga Ohumahi - Paearu mahi Workforce Data 2023 - Conditions of employment
-
5.3
Raraunga Ohumahi - Te whakataurite oranga me te mahi Workforce Data 2023 - Balancing life and work
-
5.4
Raraunga Ohumahi - Te nekeneke Workforce Data 2023 - Mobility
-
5.5
Raraunga Ohumahi - Te āheinga Workforce Data 2023 - Capability
-
5.1
-
Section 06
Guidance: Data drilldown and technical guidance 2023
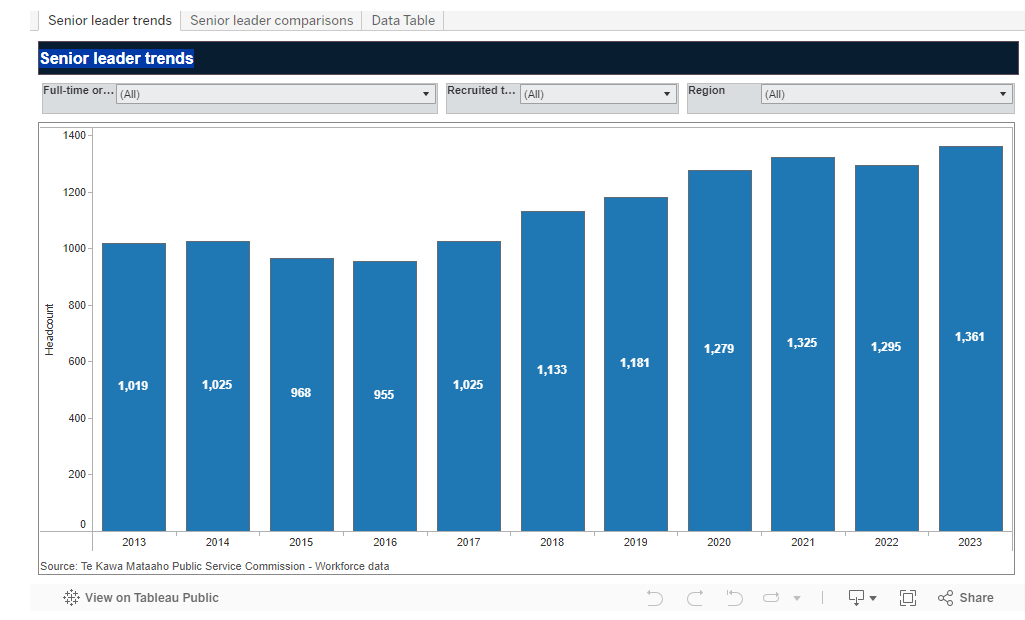
The information collected from Workforce Data for senior leader composition covers seniority profile, leader metrics and diversity in public service leaders.
Seniority profile
As at 30 June 2023, 12.5% of the Public Service workforce were management staff, led by 41 Public Service leaders (39 secretary and chief executive positions, and the 2 Deputy Public Service Commissioners), 5 of whom were in acting positions.
The latest leader profiles are available here: Who leads the Public Service
In total, there were 1,361 senior managers (tiers 1, 2 and 3), and 6,765 other managers. The remaining 87.5% (56,645) were non-management staff.
Senior leader metrics (tiers 1 to 3)
As at 30 June 2023, there were 1,361 senior leaders in the Public Service (defined as the top 3 tiers of managers with chief executives being tier one). This compares to 1,295 senior leaders last year.
The percentage of women in the top 3 tiers of senior management was 55.9% (up slightly from 55.8% last year and 48.8% in 2018), while male representation is 43.2%.
Senior leaders reported being 78.3% European, 16.0% Māori, 5.1% Pacific peoples and 3.1% Asian (these add to more than 100% as it includes those with multiple ethnicities). Although, Pacific and Asian leaders continue to remain under-represented compared to either the Public Service workforce or the New Zealand population, there has been improvement in representation over the past five-years:
- Māori representation is now 16.0% (up from 14.5% in 2022 and 11.5% in 2018).
- Pacific representation is now 5.1% (unchanged from 2022 but up from 2.6% in 2018).
- Asian representation is now 3.1% (up from 3.0% in 2022 and 2.2% in 2018).
Annual sick leave usage for senior leadership was 5.1 days in 2023. This is low compared with the 7.7 days for the other managers group and 9.8 days on average for non-managerial staff which are also at record high levels. Sick leave usage in 2023, for both senior leaders and the Public Service workforce as a whole, were at the highest level since measurement began in 2000. The 2023 Southern Cross / Business NZ Workplace Wellness Report found that average employee absence rates from New Zealand workplaces were at their highest level since the survey began in 2012. The report discusses potential drivers for this increase, such as COVID-19.
Senior leaders data table by agency
Te Pae Turuki | Public Service Leaders Group
Te Pae Turuki Public Service Leaders Group (PSLG) is comprised of senior public servants in the most complex and influential leadership roles. It is about working together and providing strong collaborative leadership across the system. PSLG leaders enable continued innovation to tackle some of the biggest and most complex issues facing New Zealand today.
Members of the PSLG are nominated by chief executives according to role-based criteria that the Commission sets. Nominations are not tier-based. Instead, members must meet one or more of the following criteria:
- is a member of an executive team
- runs a Public Service business for New Zealand or a significant region
- heads a corporate function in a medium or large organisation
- creates high strategic impact, working across larger organisations and, in concert with other organisations
As at 30 March 2023, there were 1,142 members of the PSLG, 51% female and 49% male.
The latest Te Pae Turuki Public Service Leadership Group results are available here: Te Pae Turuki Public Service Leaders Group
Diversity in Public Service leaders
As at 30 June 2023, the 41 Public Service Leaders reported being 82.5% European, 15.0% Māori, 7.5% Asian and 5.0% Pacific peoples (these add to more than 100% as it includes those with multiple ethnicities).
At that same point in time, women held 22 of the 41 Public Service Leader roles. Current information can be found on the Public Service Leaders page.
The latest leader profiles are available here: Who leads the Public Service