-
Section 01
Workforce data 2023 - Senior leadership
-
Section 02
Workforce data 2023 - Remuneration/pay
-
Section 03
Workforce data 2023 - Public sector composition
-
Section 04
Workforce data 2023 - Diversity and inclusion
-
4.1
Raraunga Ohumahi - Te iwitanga i roto i te Ratonga Tūmatanui Workforce Data 2023 - Ethnicity in the Public Service
-
4.2
Raraunga Ohumahi - Te Ira Tangata i roto i Te Ratonga Tūmatanui Workforce Data 2023 - Gender representation in the Public Service
-
4.3
Raraunga Ohumahi - Āniwaniwa Workforce Data 2023 - Rainbow
-
4.4
Raraunga Ohumahi - Hunga whaikaha Workforce Data 2023 - Disability
-
4.5
Raraunga Ohumahi - Kāhua taipakeke Workforce Data 2023 - Age profile
-
4.6
Raraunga Ohumahi - Hāhi Workforce Data 2023 - Religion
-
4.7
Raraunga Ohumahi - Whakaurunga Workforce Data 2023 - Inclusion
-
4.1
-
Section 05
Workforce data 2023 - Working in the Public Service
-
5.1
Raraunga Ohumahi - Te hauora i roto i te mahi Workforce Data 2023 - Wellbeing at work
-
5.2
Raraunga Ohumahi - Paearu mahi Workforce Data 2023 - Conditions of employment
-
5.3
Raraunga Ohumahi - Te whakataurite oranga me te mahi Workforce Data 2023 - Balancing life and work
-
5.4
Raraunga Ohumahi - Te nekeneke Workforce Data 2023 - Mobility
-
5.5
Raraunga Ohumahi - Te āheinga Workforce Data 2023 - Capability
-
5.1
-
Section 06
Guidance: Data drilldown and technical guidance 2023
The remuneration information collected from Workforce Data for senior leader remuneration and pay covers average salary changes and ratios, as well as chief executive remuneration and disclosure information.
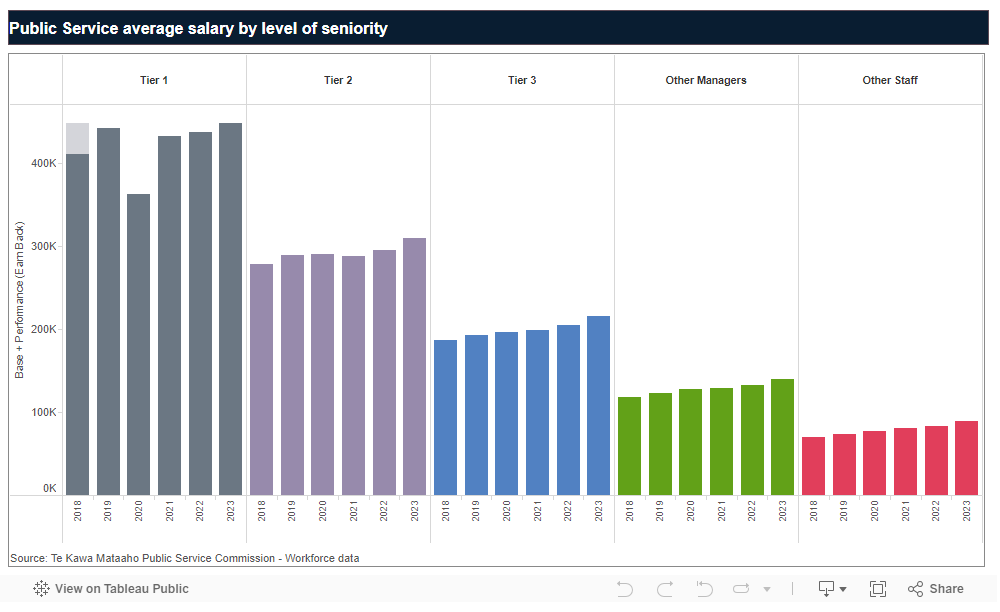
Average salary changes by seniority
In 2023, the average base salary for the workforce at Public Service departments and departmental agencies increased by 7.0%, following increase of 3.7% in both preceding years (base salary is used as total remuneration is not collected in Workforce Data). The increase for non-management staff was 7.3%, compared with 5.3% for management staff. By tier, average salary showed increases of 4.9% for tier 2 managers, 5.3% for tier 3 managers and 5.3% for other managers. The average salary for chief executives (tier 1 managers) increased by 2.4% over the same time.
When looking at the chart below, two other points to note for chief executives (tier 1 managers) are:
- The 7.6% increase in 2019 was due to a change introduced to chief executive remuneration packages. This was an adjustment rolled into base salary to account for the removal of performance, or at-risk payments which were outside of base salary. The chart shows estimated average size of these at-risk payments that sit above the base salaries for the preceding years.
- In response to COVID-19, all Public Service chief executives adopted a voluntary 20% reduction in pay, effective for 6 months from 11 May 2020. The reversal of this reduction resulted in incumbent chief executives seeing a 19% increase in 2021.
Average salaries for chief executives can fluctuate over time, because of the small number in the group and the effect of compositional changes due to arrivals and departures each year. The comparisons here use base salaries.
For more accurate measures of how chief executive total remuneration changes over time, refer to Chief executive remuneration.
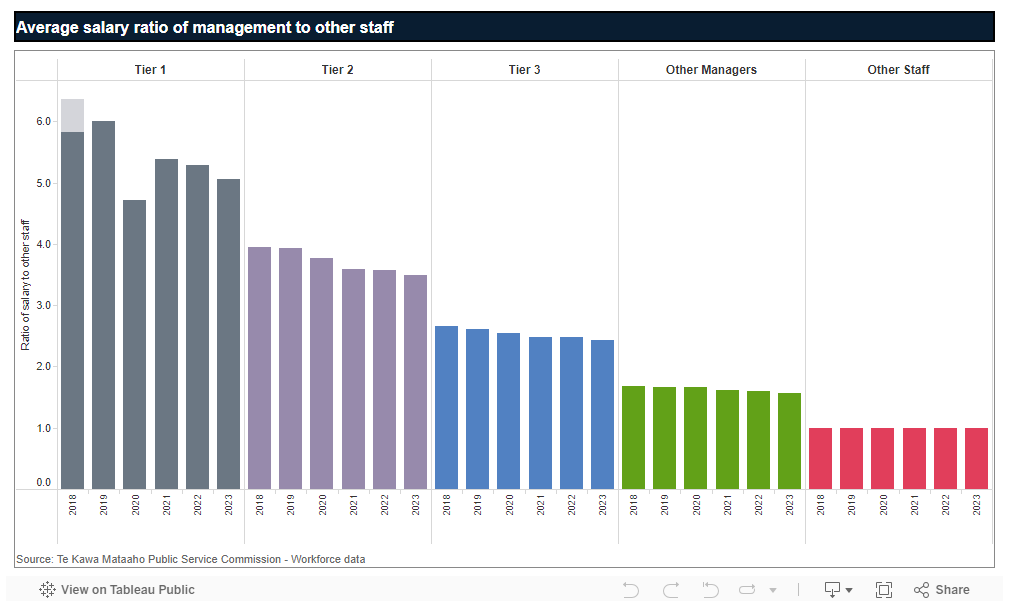
Average salary ratios
The chart on the first tab of the visualisation below shows the ratios of average base salary for the 4 management levels compared to non-management staff. These ratios have been quite stable over the last 6 years, except for the chief executive group. As at 30 June 2023, the average base salary of incumbent chief executives in the Public Service was 5.1 times that of non-management staff.
This ratio had been trending downwards, once you consider the change introduced to chief executive remuneration packages in 2019, with an adjustment rolled into base salary to account for the removal of performance or at-risk payments (which were outside of base salary). The effect of this is estimated in the chart below. The sharp drop in 2020 was due to Public Service chief executives adopting a voluntary 20% reduction in pay, effective for 6 months from 11 May 2020. The increase in 2021 was due to the reversal of this reduction.
Except during this voluntary and temporary drop in 2020, the current salary ratio of 5.1 is the lowest salary ratio between chief executives and non-management staff since current records began in 2001.
The ratios for other management levels were:
- tier 2 manager at 3.5
- tier 3 manager at 2.4
- other managers at 1.6 times relative to non-management staff.
When comparing the average base salary of chief executives to all other staff (including managers) the ratio was 4.6. Except for 2020, this is also the lowest this ratio has been since current records began.
These Public Service chief executive and staff pay ratios are modest compared to the market ratios of publicly listed New Zealand firms. A 2021 Stuff survey of the largest 20 companies in the benchmark NZX50 found that chief executive pay was between 16- and 40-times worker pay.
2021 Survey results on NZX50 chief executive pay — Stuff.co.nz