-
Section 01
Workforce data 2023 - Senior leadership
-
Section 02
Workforce data 2023 - Remuneration/pay
-
Section 03
Workforce data 2023 - Public sector composition
-
Section 04
Workforce data 2023 - Diversity and inclusion
-
4.1
Raraunga Ohumahi - Te iwitanga i roto i te Ratonga Tūmatanui Workforce Data 2023 - Ethnicity in the Public Service
-
4.2
Raraunga Ohumahi - Te Ira Tangata i roto i Te Ratonga Tūmatanui Workforce Data 2023 - Gender representation in the Public Service
-
4.3
Raraunga Ohumahi - Āniwaniwa Workforce Data 2023 - Rainbow
-
4.4
Raraunga Ohumahi - Hunga whaikaha Workforce Data 2023 - Disability
-
4.5
Raraunga Ohumahi - Kāhua taipakeke Workforce Data 2023 - Age profile
-
4.6
Raraunga Ohumahi - Hāhi Workforce Data 2023 - Religion
-
4.7
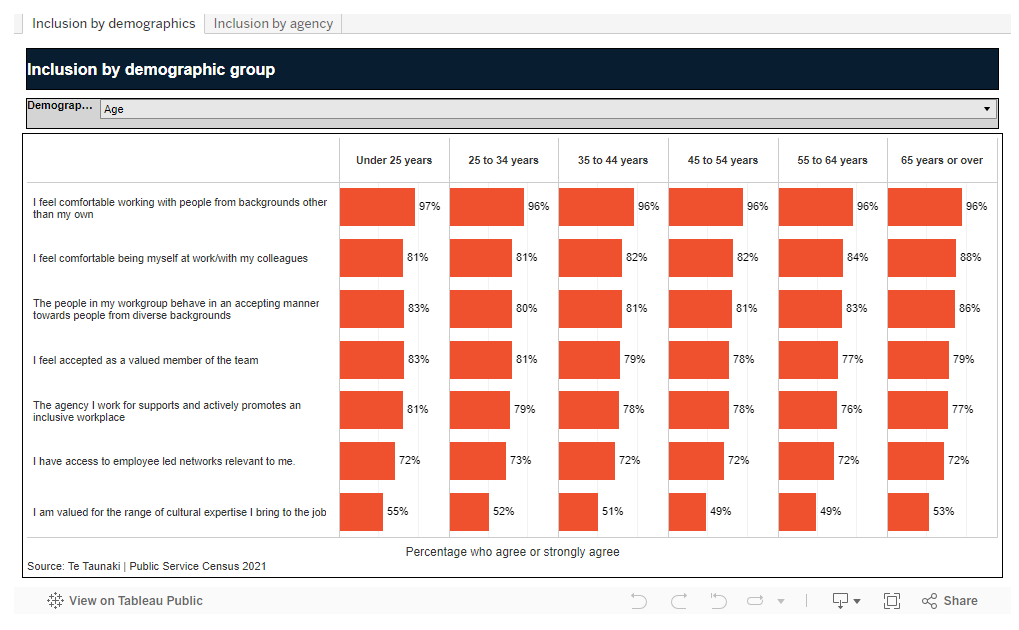
Raraunga Ohumahi - Whakaurunga Workforce Data 2023 - Inclusion
-
4.1
-
Section 05
Workforce data 2023 - Working in the Public Service
-
5.1
Raraunga Ohumahi - Te hauora i roto i te mahi Workforce Data 2023 - Wellbeing at work
-
5.2
Raraunga Ohumahi - Paearu mahi Workforce Data 2023 - Conditions of employment
-
5.3
Raraunga Ohumahi - Te whakataurite oranga me te mahi Workforce Data 2023 - Balancing life and work
-
5.4
Raraunga Ohumahi - Te nekeneke Workforce Data 2023 - Mobility
-
5.5
Raraunga Ohumahi - Te āheinga Workforce Data 2023 - Capability
-
5.1
-
Section 06
Guidance: Data drilldown and technical guidance 2023
The data we collected from Te Taunaki Public Service Census 2021 gave us a better understanding of the diversity of public servants and whether they feel supported to be themselves at work.
Being supported and feeling comfortable at work
Te Taunaki found that 8 in 10 public servants (82%) feel they can be themselves at work and most people (78%) felt that their organisation supports and promotes an inclusive workplace. Almost everyone (96%) reported feeling comfortable working with people from backgrounds other than their own.
Most people (72%) said they had access to employee-led networks that were relevant to them. However, those from smaller ethnic groups were less likely to have access compared to their Pacific, Māori, Asian, and European colleagues.
Te Taunaki also told us that some of our people from Rainbow communities, those who reported a mental health condition or disability, and those from smaller ethnic groups felt less able to be themselves at work.
This visualisation allows you to explore Census results on feelings of inclusion by various demographic groups.
We use the ‘social model’ of disability and promote the participation and leadership of disabled people in society, with the same access to opportunities as non-disabled people. ‘For more information, the Office for Disability Issues website has more information.
Guidance for policy makers — Office for Disability Issues
Disability information was gathered through the commonly used Washington Group Short Set of Questions on Disability which is not designed to provide disability counts or prevalence rates. The Washington Group Questions on Disability are internationally recognised as the best way to gather disability information.